The 15-minute city,
tested.
Everyone talks about the "15-minute city." I wanted to actually measure it. I built a hex-based walking accessibility model and ran the same pipeline against three cities with completely different urban forms (Beirut, Porto, and Luxembourg), scoring how well each one puts healthcare, schools, daily shopping, green space, and public transport within a 15-minute walk.
One pipeline, three cities, the same rules
Each city is tiled into uniform H3 hexagons, about 0.1 km² each: 181 hexes for Beirut, 363 for Porto, 548 for Luxembourg. A real pedestrian street network is pulled from OpenStreetMap for each city, and every hex gets a Hansen accessibility score per category: route along the actual street network to every matching amenity within a 15-minute walk, and weight each one by how close it is, so a shop next door counts far more than one right at the cutoff.
Built on accessx, an open-source Python toolkit purpose-built for this kind of hex-based, network-routed accessibility work, with OSMnx for street networks and points of interest, NetworkX for routing, H3 for the hex grid, and GeoPandas for the spatial handling. Every amenity and every street comes from OpenStreetMap, and city boundaries were geocoded via Nominatim.
The street network is the story before the story
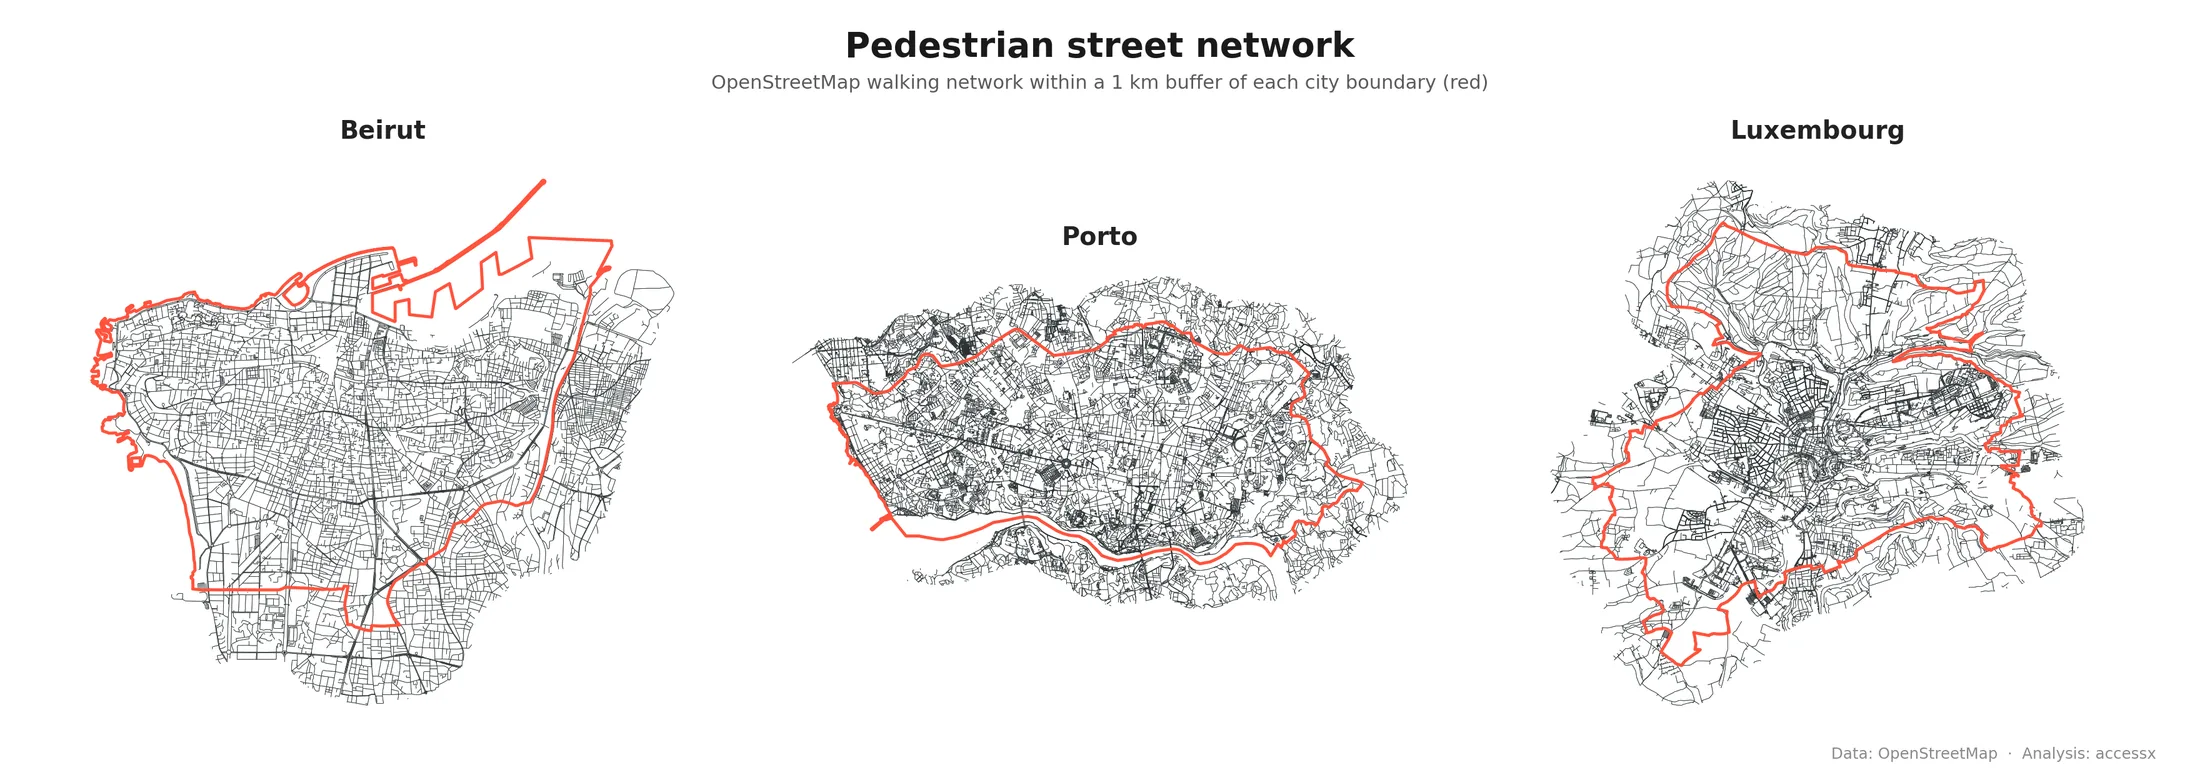
Porto's core is dense and tightly gridded. Luxembourg's is sparser and tree-like, a dendritic, cul-de-sac-heavy pattern typical of lower-density, car-oriented planning, especially toward its northern and southern edges. Beirut sits in between: dense at the centre, with a clear radial structure. Nothing that follows should be a surprise once you've seen how differently connected these three networks are.
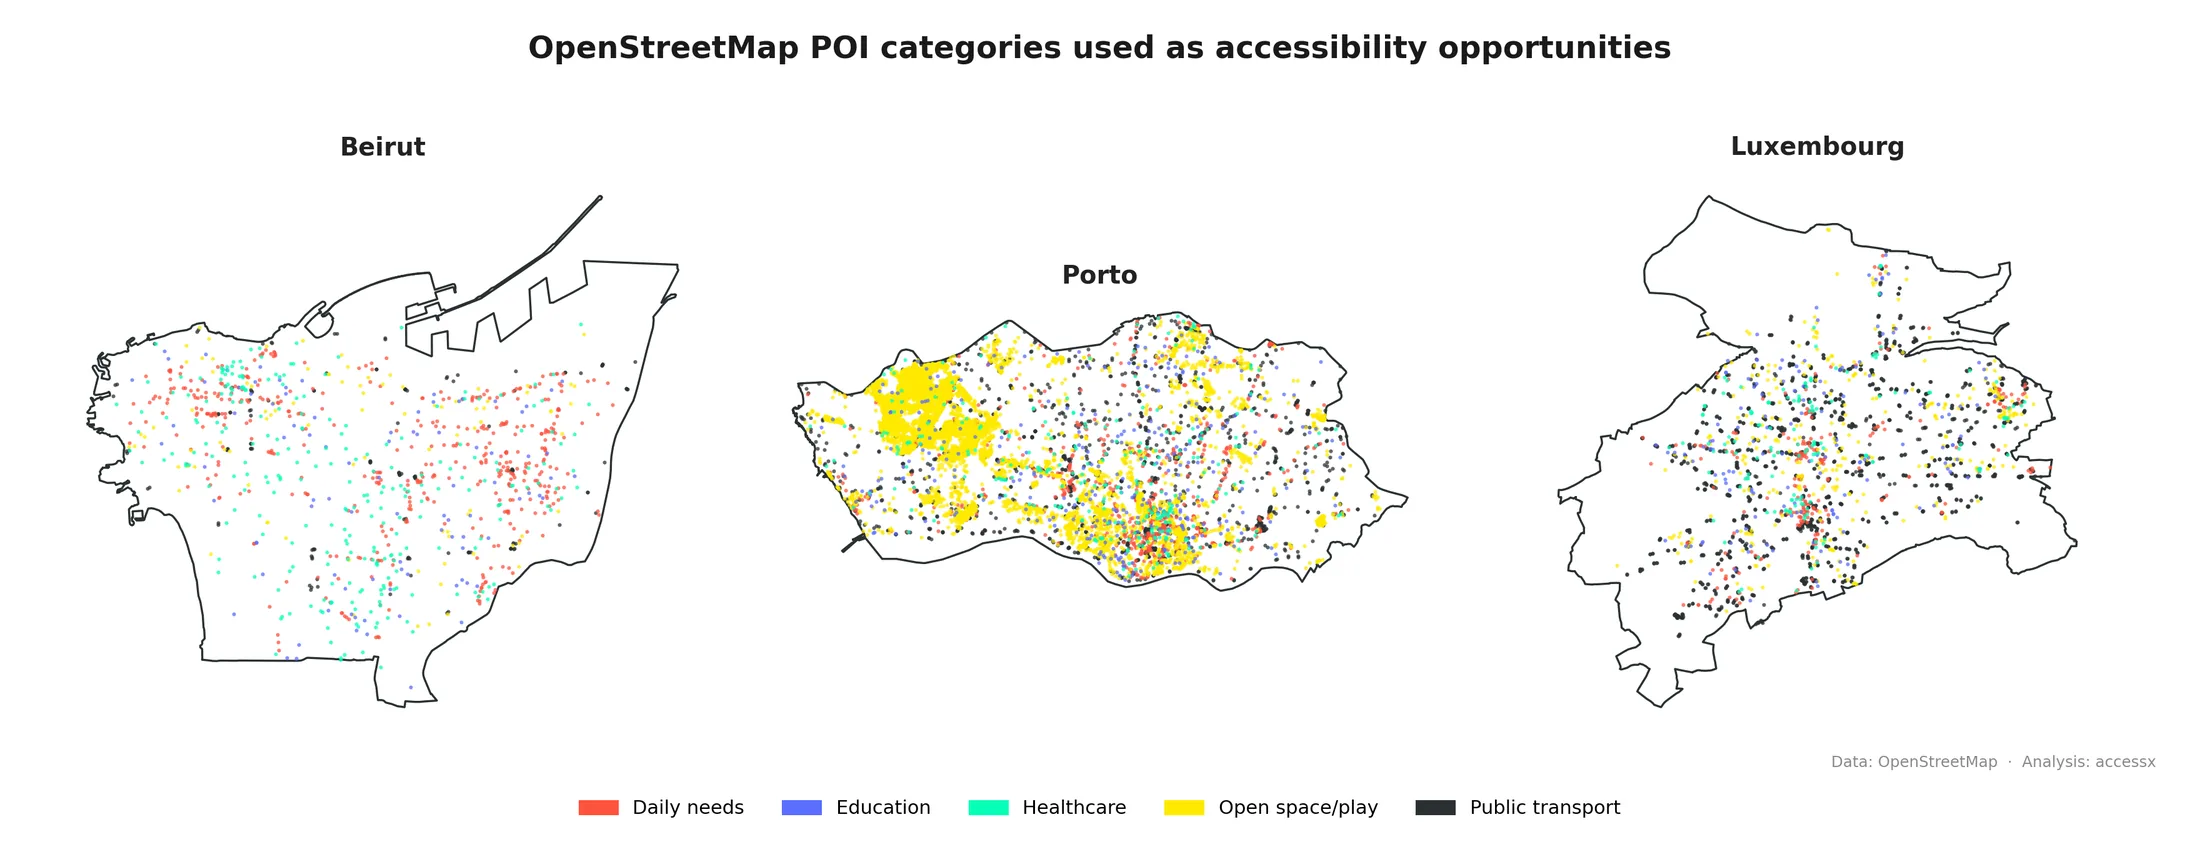
The amenities themselves show the same imbalance from a different angle. Porto's open-space points are so dense they merge into solid blobs rather than discrete dots, an early preview of why Porto dominates every green-space comparison later. Beirut's points are scattered fairly evenly across daily needs and healthcare, with visibly fewer open-space and transport points. Luxembourg's look comparatively sparse and clustered toward its centre.
Beirut's strongest category, by a wide margin
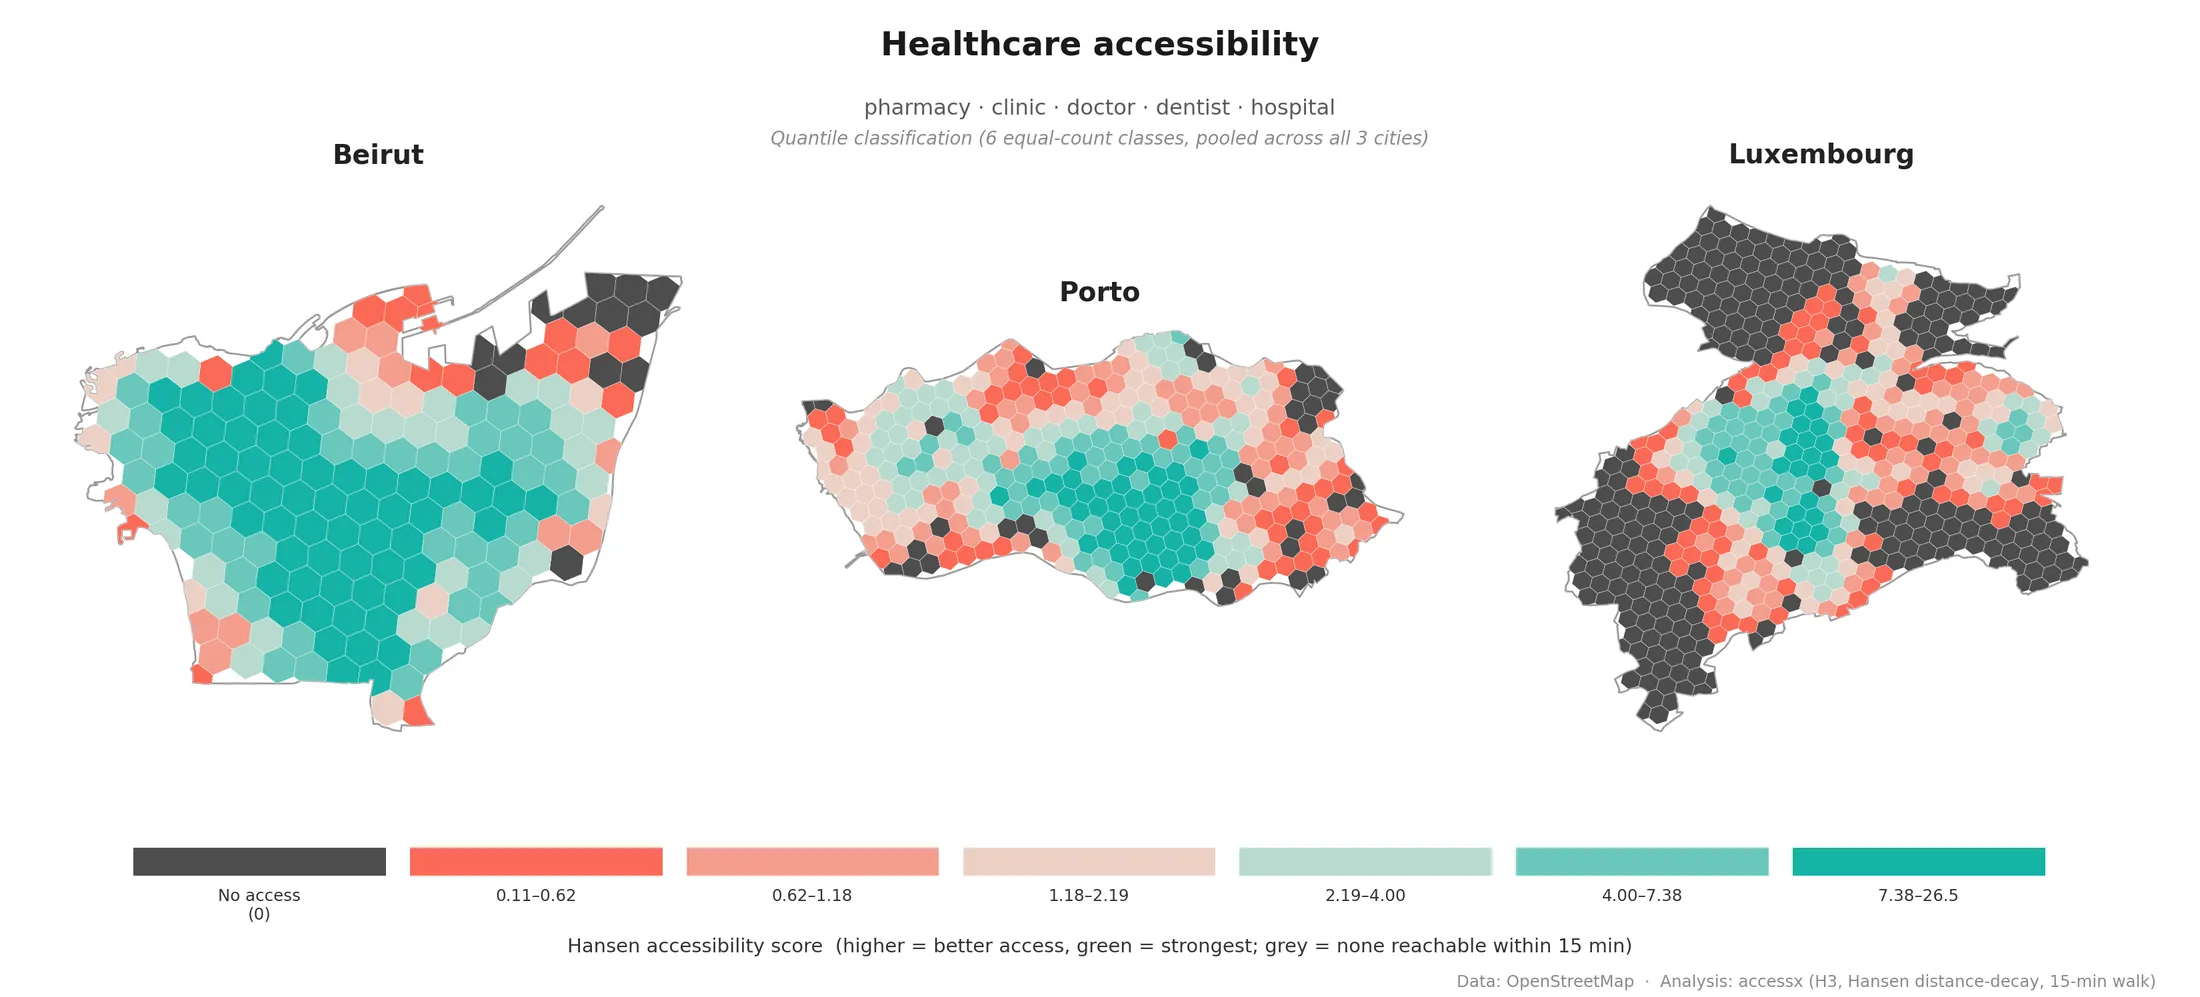
Only about 7% of Beirut's hexes have zero healthcare access within 15 minutes, against 10% for Porto and 46% for Luxembourg. Porto's access is real but tight, concentrated around its historic centre and fading fast outward. Luxembourg splits in two: a solid mid-to-high band through the centre, then a large grey, zero-access zone across its entire northern third and much of the southern edge, a genuine gap, not a colouring artifact.
Strong centres, sharp edges
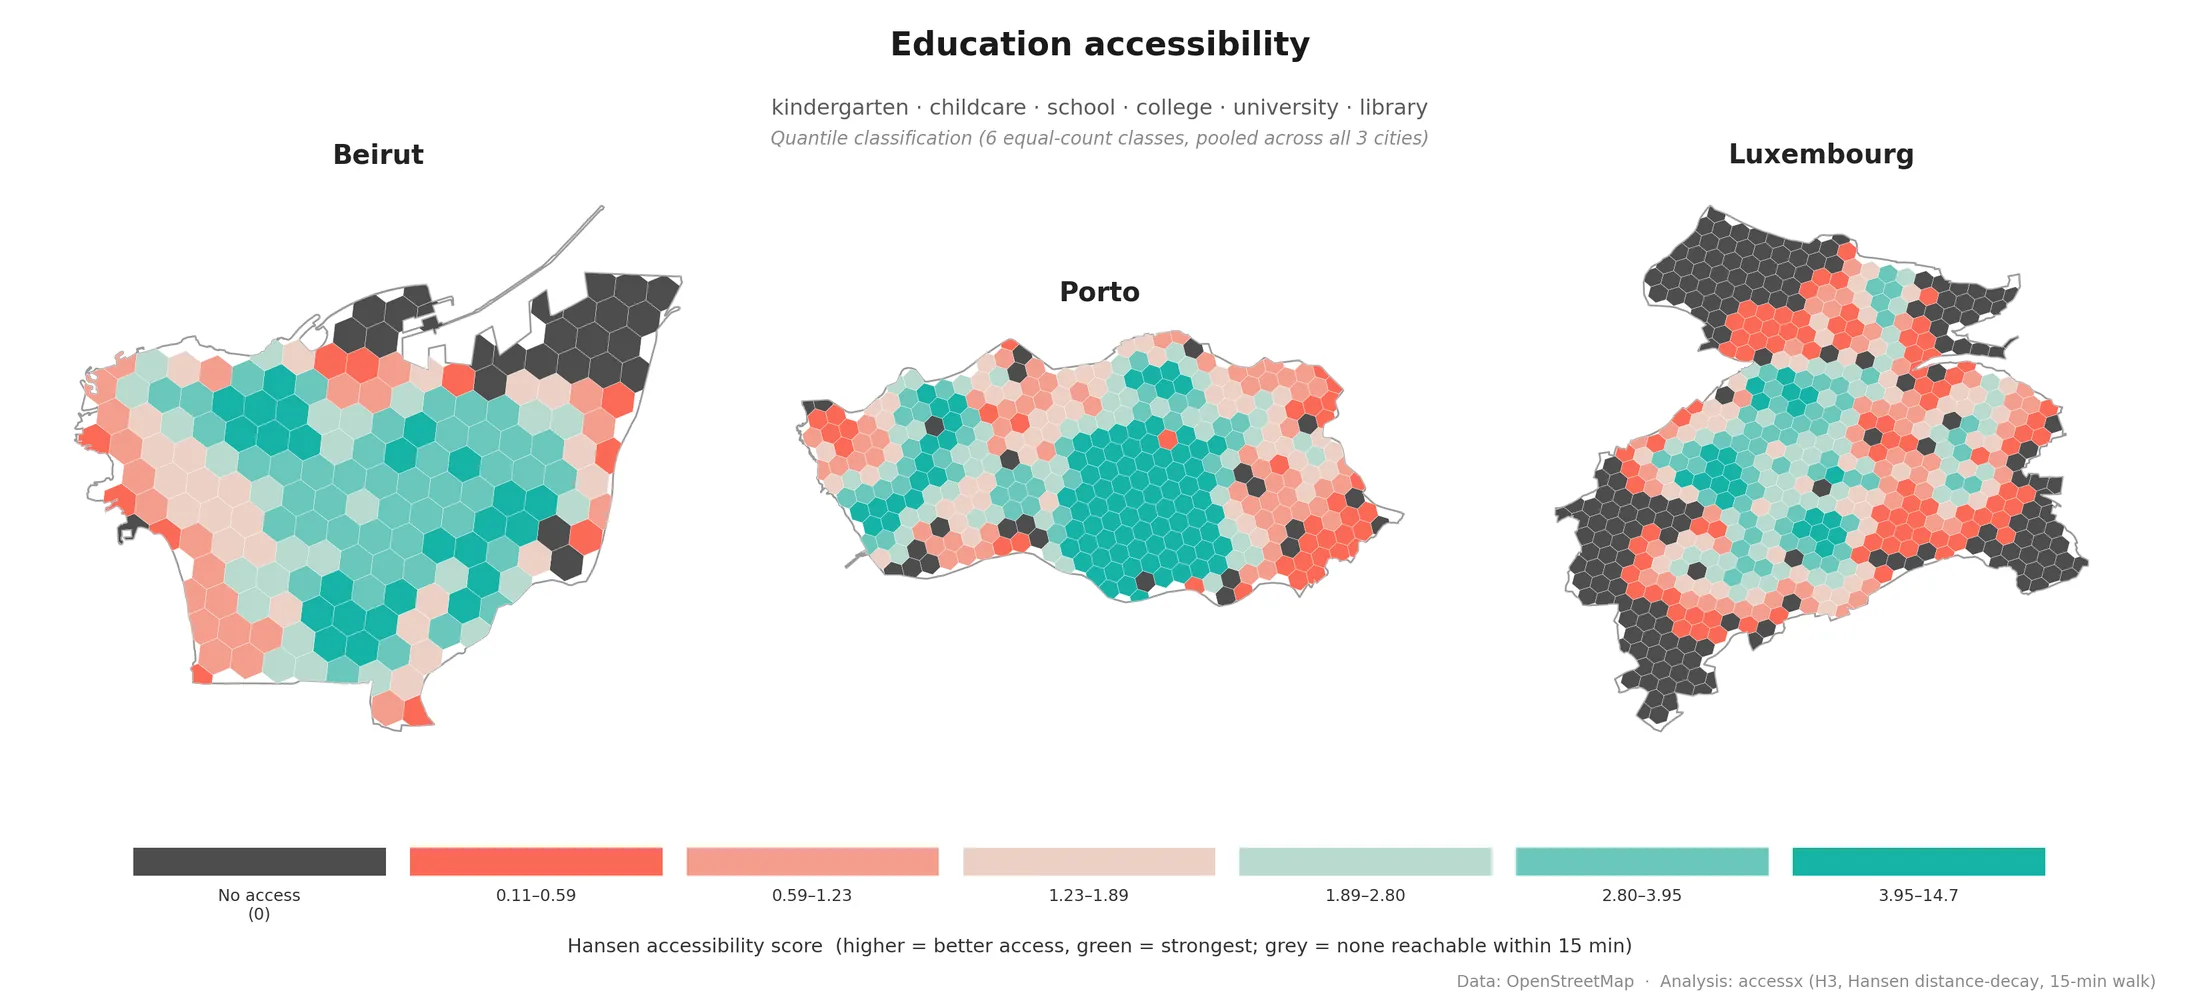
Beirut and Porto both serve their cores well: Beirut's access spreads wider, Porto's peaks harder in a tighter zone. Luxembourg's centre reaches a respectable mid-tier, so schools and libraries do serve the urban core adequately, but coverage drops off sharply and consistently toward the edges, with the north again showing heavy zero-access grey.
The category that tracks small-shop density
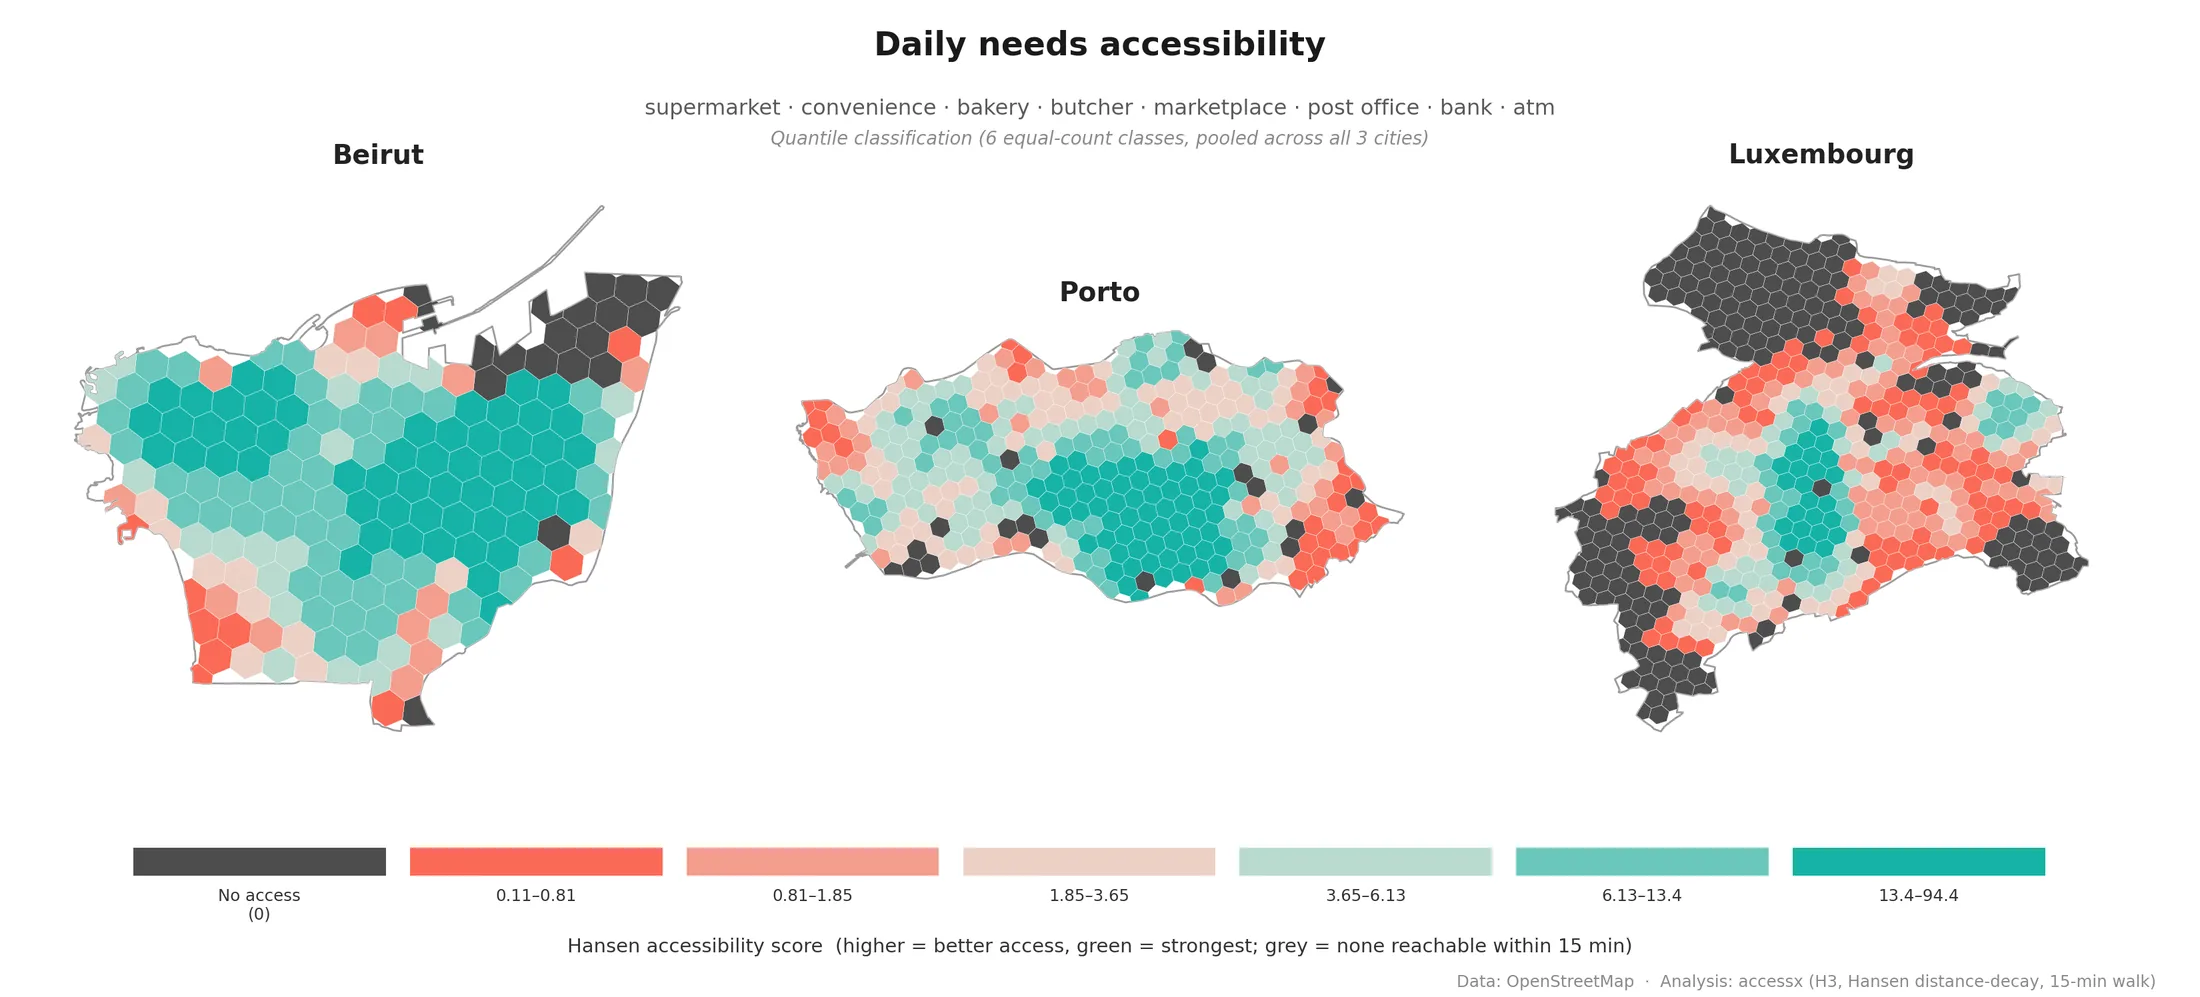
Beirut has the strongest, most evenly spread daily-needs access of the three cities. Porto's concentrates around its centre with a visible ring of weaker access at the edges. Luxembourg is weakest here in both magnitude and evenness: more than a third of its hexes have zero access. The underlying density backs this up: 20.9 daily-needs points per km² in Beirut and 17.0 in Porto, against 4.35 in Luxembourg.
The starkest gap in the whole analysis
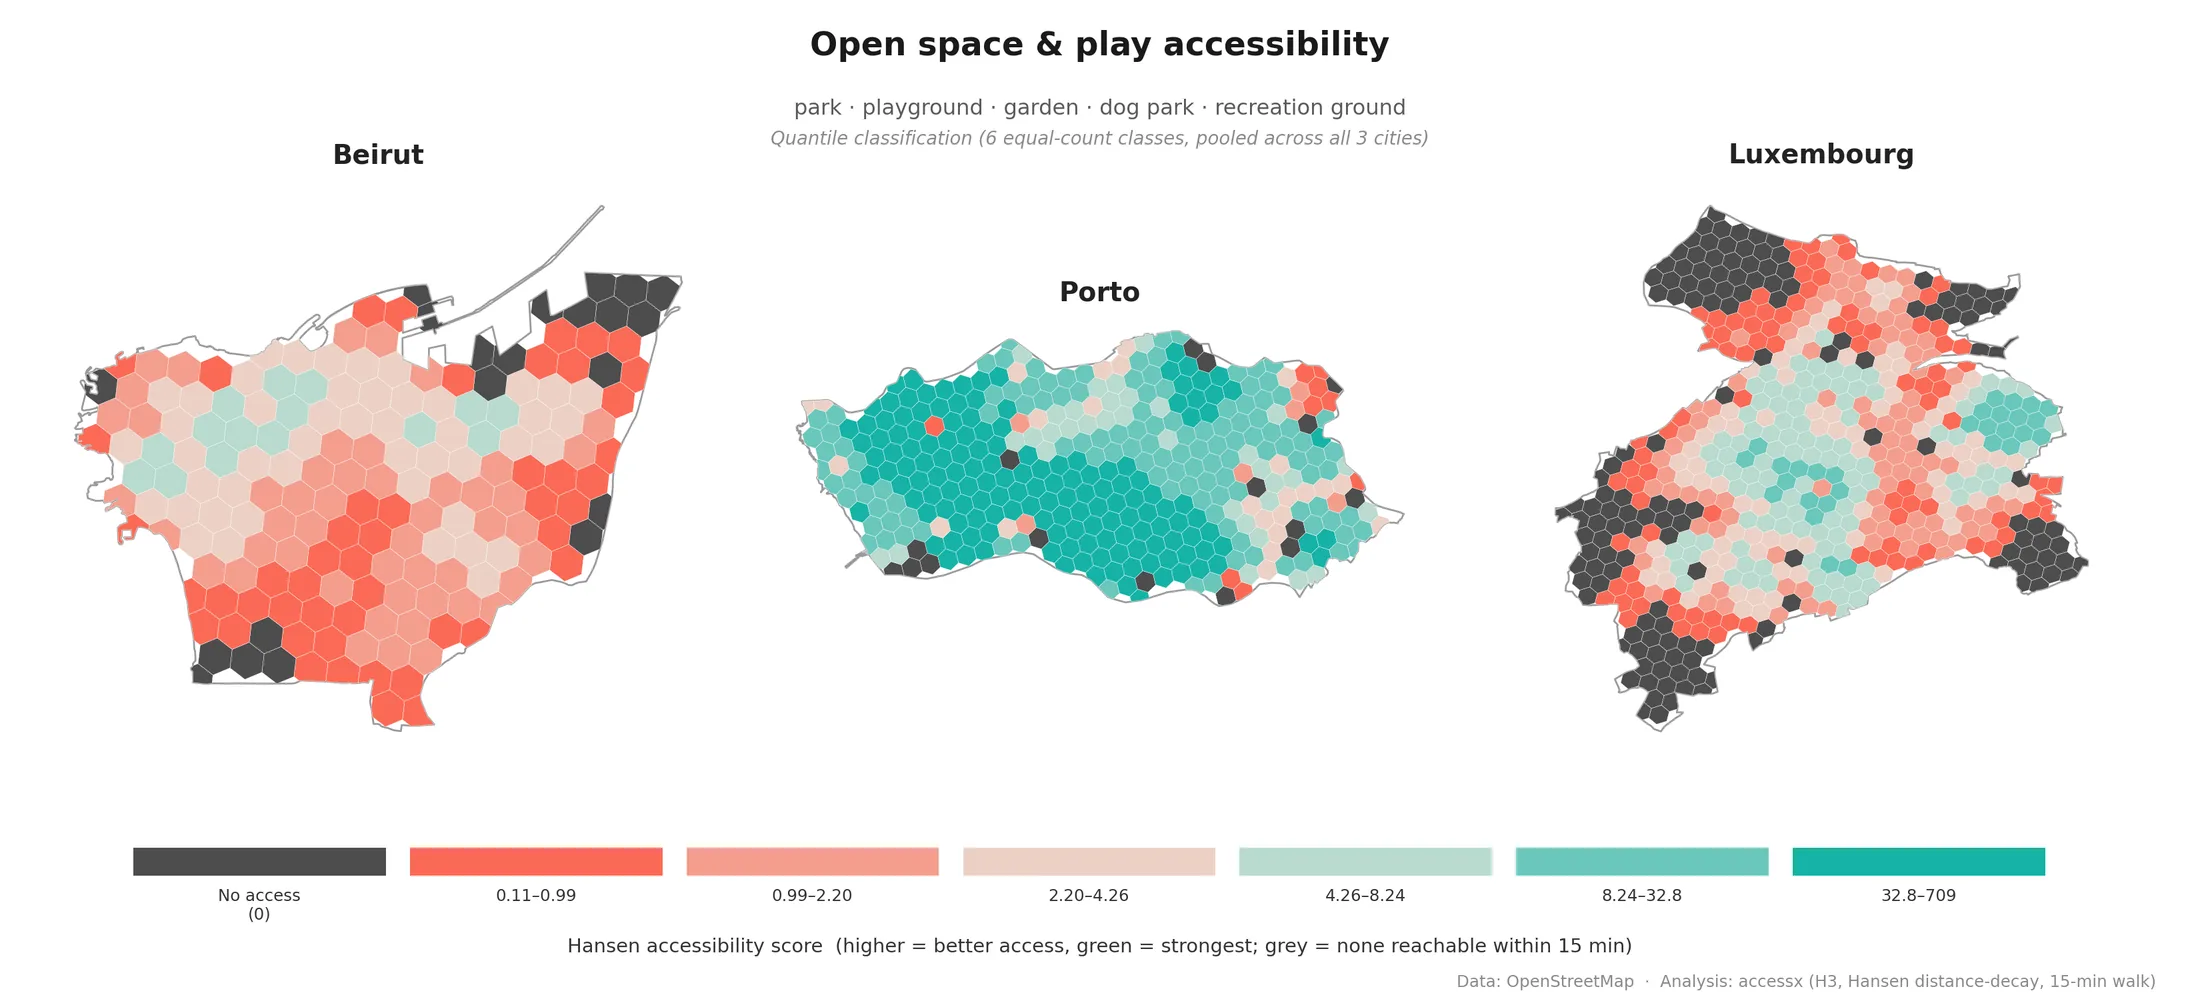
Porto occupies nearly the entire high end of the scale on its own, with raw Hansen scores as high as 709, against 5.9 for Beirut and 21 for Luxembourg. Beirut and Luxembourg both look almost uniformly poor here, with only small, scattered pockets breaking into the mid tier. The gap is large enough that no reclassification meaningfully closes it: 92 mapped open-space points in Beirut versus 6,958 in Porto. I should mention that this approach does not capture the full complexity of open space accessibility as it does not consider areas not officially designated as open space. For example this can include Beirut's waterfront and Luxumbourgs natural surroundings.
Transport accessibility
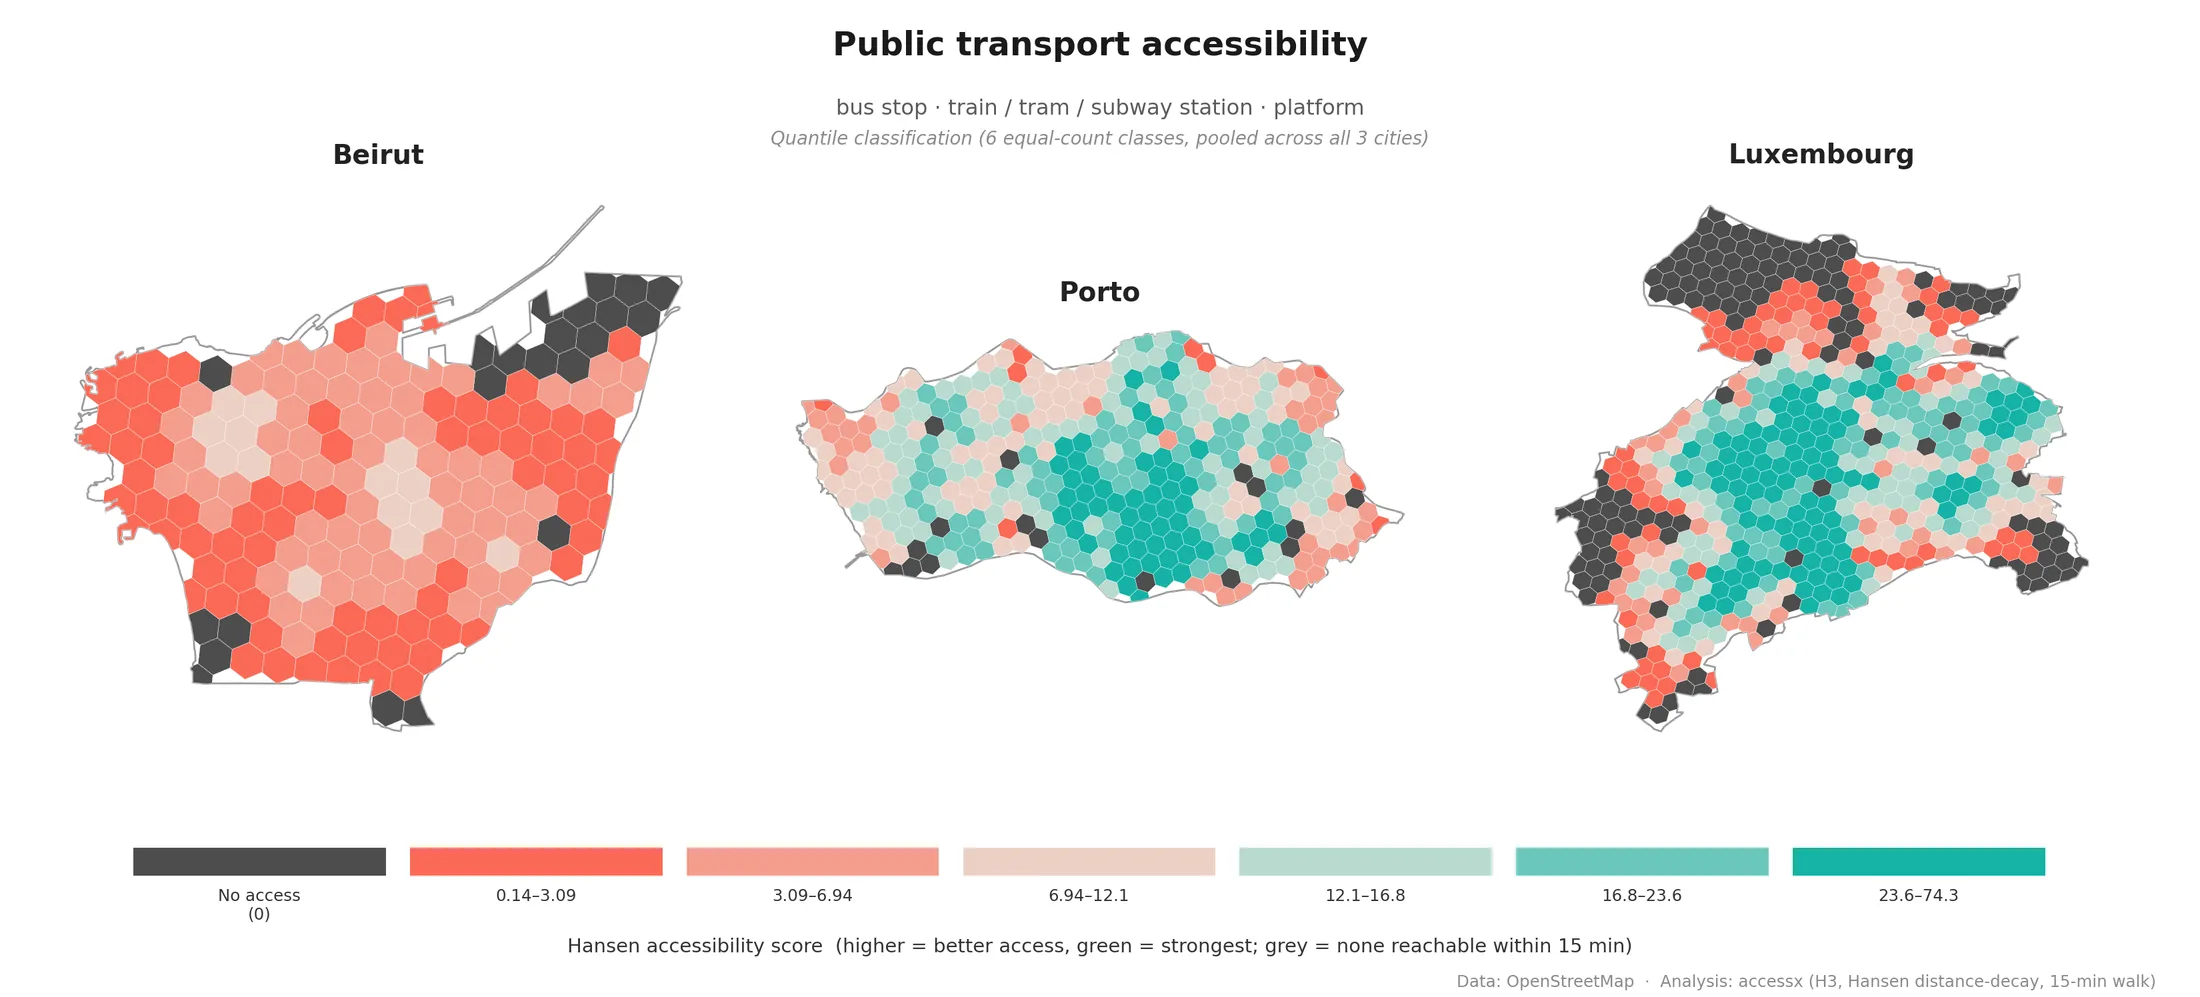
Beirut barely reaches the low-to-mid tier anywhere, consistent with an informal, thinly-mapped transit system. Porto and Luxembourg both show strong, well-defined cores: Luxembourg's is the most extensive of the three, reflecting its dense, fare-free nationwide bus network. This is the one category carrying Luxembourg's combined score.
Each city's overall accessibility
Averaging the five normalised category scores per hex, Porto has the strongest and most spatially concentrated core. Beirut's is broader but flatter, pulled down by its north-eastern and southern edges. Luxembourg is the most fragmented of the three: a real mid-tier band through the centre, driven mostly by public transport, ringed by a large low-access periphery.
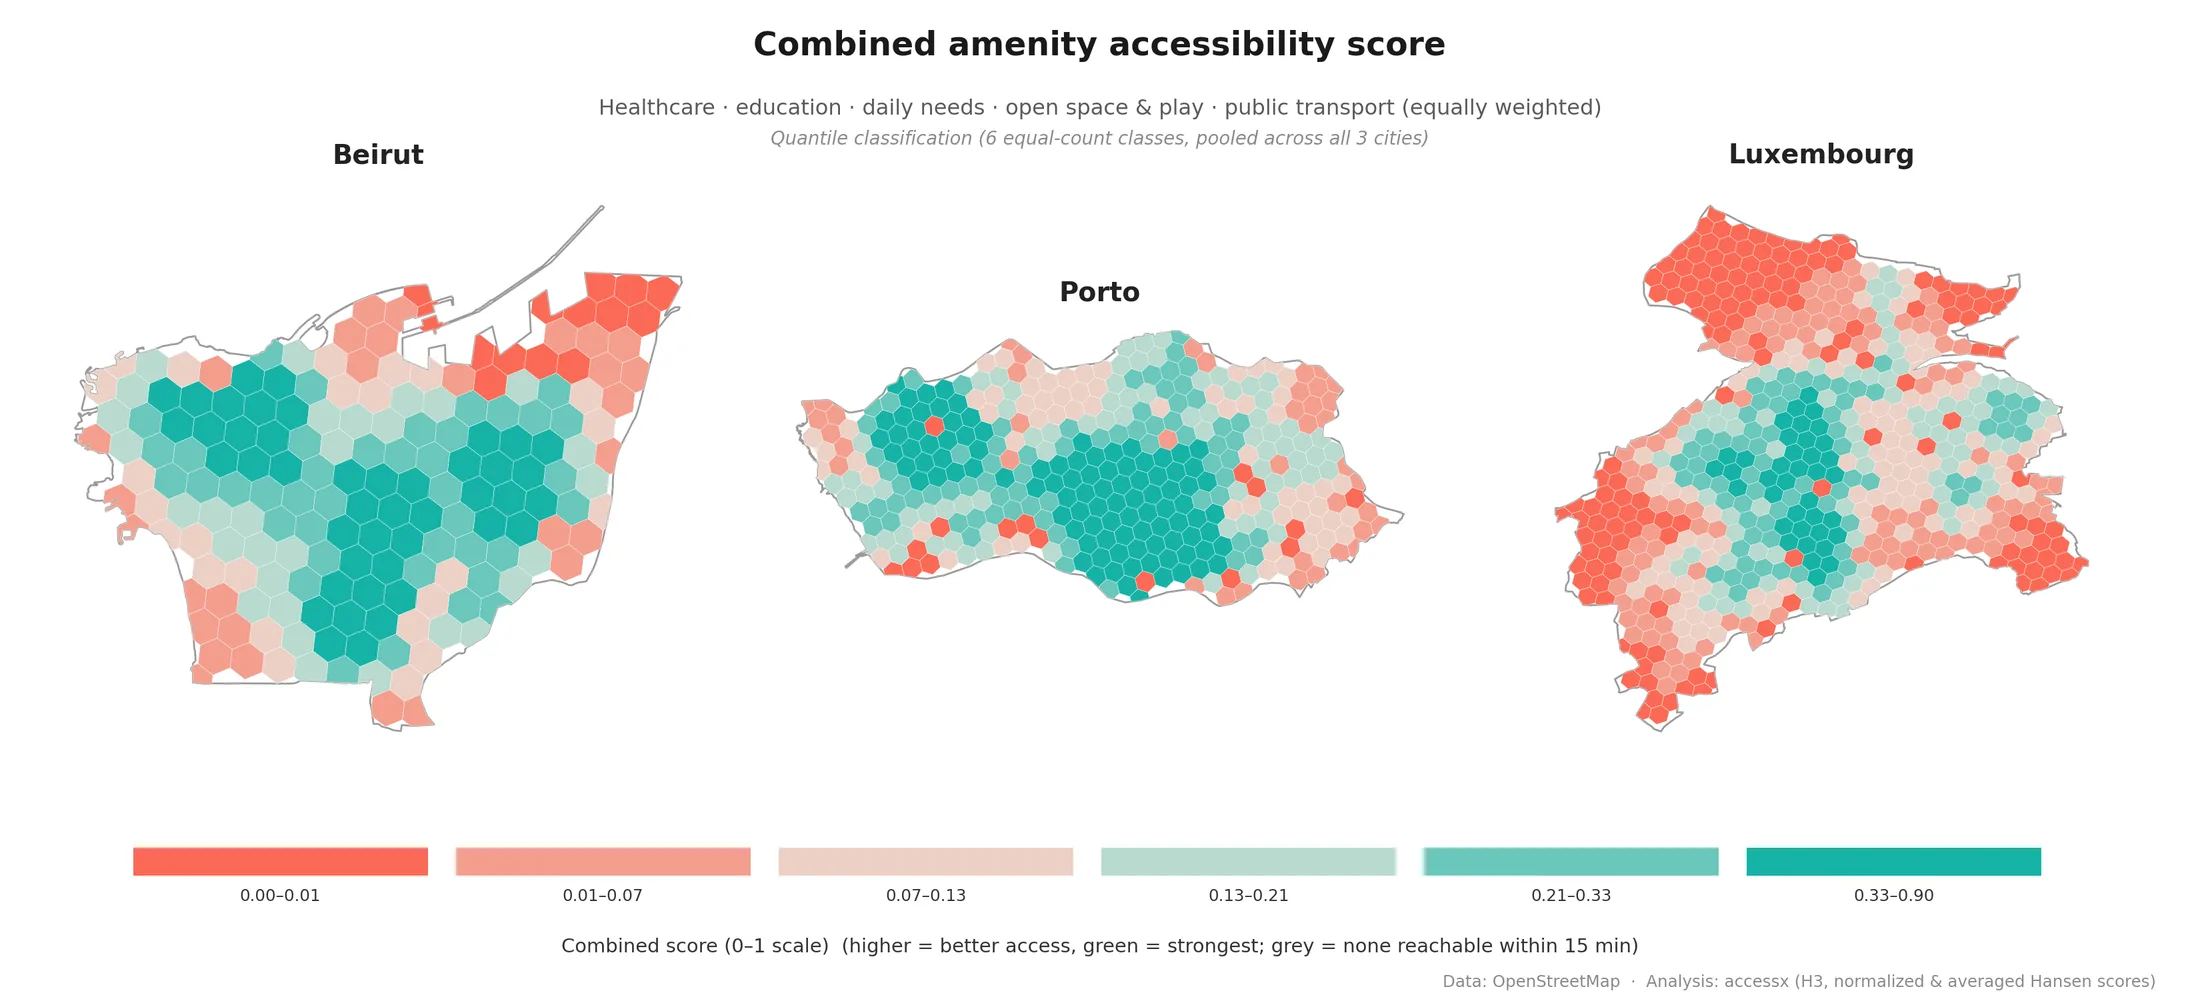
No single city wins across the board. Beirut leads on healthcare and daily needs. Porto leads on education, daily needs (tied), open space, and public transport. Luxembourg leads on nothing outright, but stays genuinely competitive on public transport, its one bright spot.
What this analysis can't tell you
Every map above describes accessibility as represented in OpenStreetMap, not verified ground truth. A few limits worth keeping in mind before treating any single finding as fact: