A framework
for site optimisation.
Public sector asset inventories can hold thousands of potential development sites. This is an exploratory thought piece on a repeatable spatial workflow that screens a large inventory down to a shortlist of priority sites for housing, each with a transparent, traceable rationale.
Which sites are genuinely developable, and why?
Assessing a large site inventory by hand is slow and inconsistent, and the reasoning is hard to defend when a planning decision is challenged. This framework explores a method that scores every site the same way, records the evidence behind each judgement, and can be re-run as the inventory changes.
The result is a spatial suitability model that measures each site against planning designations and physical constraints, then scores its shape and slope, with the evidence behind every judgement recorded at each step.
Cutting the obvious exclusions first
Before any detailed analysis, a coarse screen removes sites that could never be developed. Anything under 100 sqm is dropped as too small to build on, along with restricted land uses such as beaches, schools, electricity infrastructure, and landfill sites.
This first pass cuts the inventory to a workable set before the heavier processing begins. The screen and the spatial analysis were built in QGIS, with Python handling data cleaning and preparation throughout.
Layers of designation and constraint
Every site is assembled into a single spatial file and tested against a stack of layers spanning environmental designation, heritage, public access, and flood risk. A handful of examples, to illustrate the idea rather than list it exhaustively:
In practice, the stack can be built from almost any spatially referenced designation or constraint, environmental, heritage, access, hazard, or otherwise. Which layers matter, and where the underlying data actually lives, varies by authority: this kind of layer data is usually held internally by council planning teams rather than published openly, so the exact stack is something you'd assemble case by case.
Measuring how much of each site is constrained
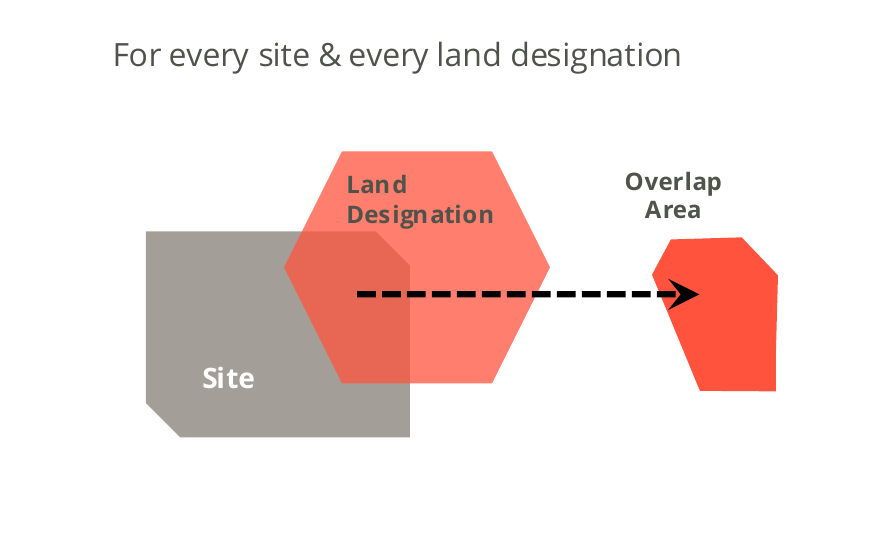
For every site and every designation, the model calculates the overlap as a percentage of the asset area. That percentage is tested against a threshold, for example 90%, and thresholds can differ by designation, so a hard environmental constraint and a softer one are not treated alike.
Two stages, so overlapping designations are counted once
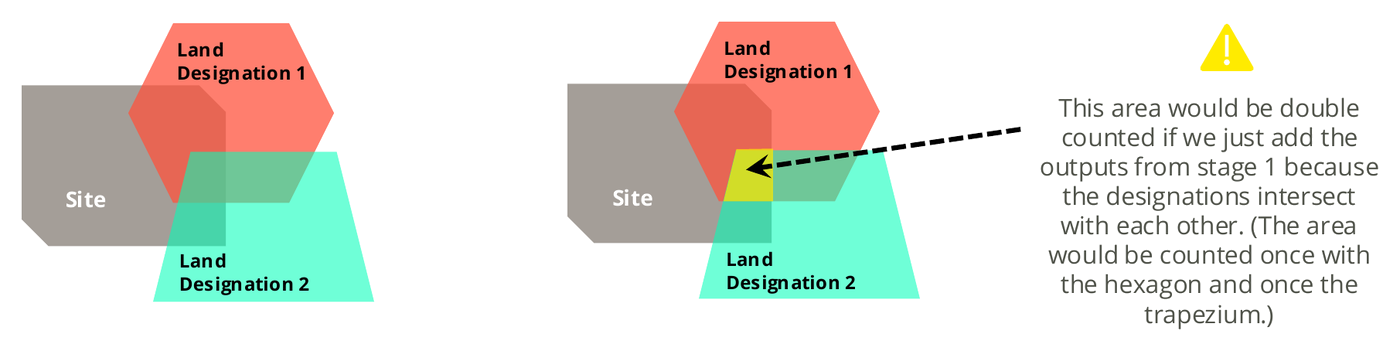
Stage 1 measures each designation against a site on its own. That is useful, but designations overlap each other, so simply adding the results counts the shared ground twice: once for each designation that covers it.
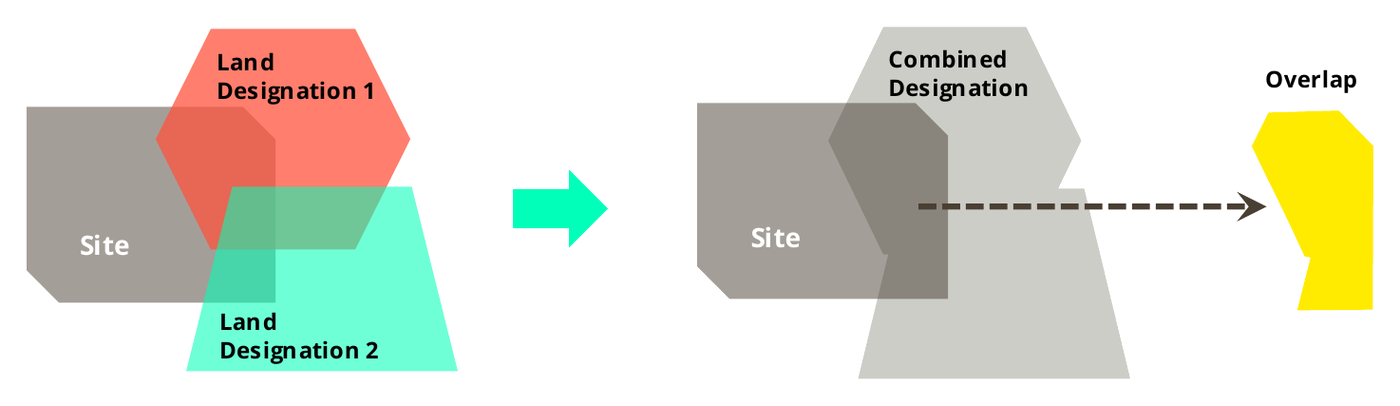
Stage 2 merges overlapping designations into a single combined shape before measuring, so every square metre of constraint is counted once. Run together, the two stages show not only how constrained a parcel is, but which designations drive that constraint.
A clear parcel can still be undevelopable
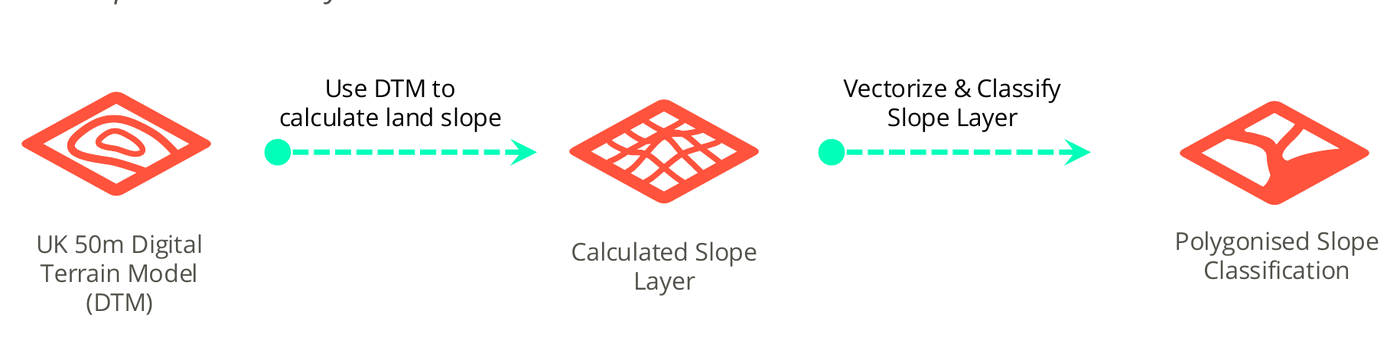
Designation is only half the picture. A site can be free of constraint yet impractical because it is too steep or too awkwardly shaped. Slope is derived from the UK 50m Digital Terrain Model, then vectorised and classified so it can be scored alongside the designation layers.
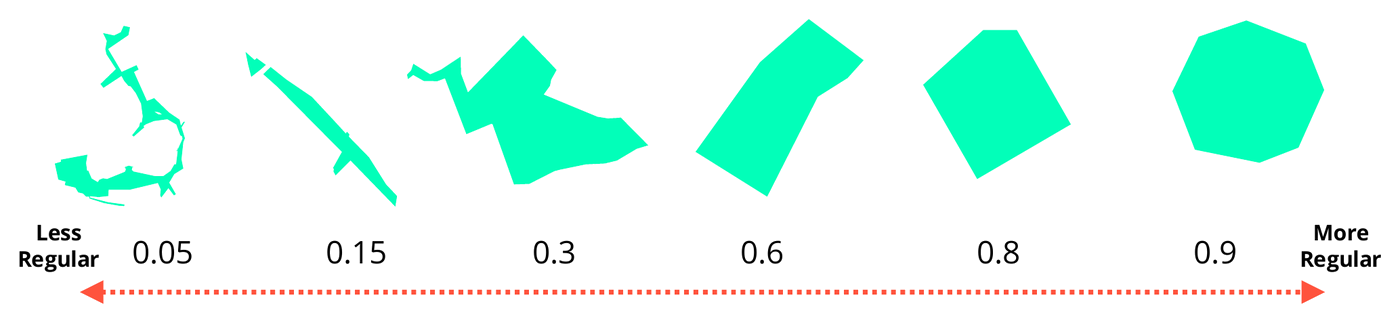
For shape, each parcel is scored with the Polsby-Popper compactness index, which measures how close a parcel is to a perfect circle:
A repeatable, fully explainable framework
Run end to end, this framework narrows a large site inventory down to a shortlist of priority sites for development. For each one the method records which designations touch it and by how much, its shape and slope, and the designations that drive its constraint. Because every step is codified, the shortlist can be regenerated whenever the inventory, layers, or thresholds change.